
Targeting of Textual-Based Market Segments
In our previous research, we investigated the viability of segmenting a market using textual data from survey open-end responses.

Embedding variables, produced by the OpenAI embedding model, summarized the meaning of open-end survey responses to the question:
“In your opinion, what are the major economic problems in your country?
Please give as much detail as possible.”
The embeddings were used as basis variables to define clusters of individuals (i.e., segments) who differed greatly in terms of their primary economic concerns. A summary of the economic concerns appears in the table below.
Table One: Segment Profiles

In this follow-up analysis, the question is: If we were to market to the individuals in a segment, would we be able to target them and find them geographically?
What follows is the analytic detail that supports the conclusions that:
- Accurate targeting of members of textual-based segments can indeed be achieved.
- Not only individual, but also geographic targeting is feasible.
Analytic Plan
The analysis:
- The segment variable (derived from the cluster analysis of the text survey responses) served as the target (i.e., dependent) variable). The modeling data included 1727 surveyed individuals residing within the U.S. lower 48 states and the District of Columbia.
- Predictor (i.e., independent) variables were obtained from the 2023 ACS (American Community Survey) 5-year aggregation at the block group level (242,747 block groups) and at the tract level (85,528 census tracts). The following data were downloaded from the U.S. Census Bureau API:
- Industry by Occupation for the Civilian Employed Population 16 Years and Over
- Agriculture, forestry, fishing and hunting, and mining
- Construction
- Manufacturing
- Wholesale trade
- Retail trade
- Transportation and warehousing, and utilities
- Information
- Finance and insurance, real estate and rental and leasing
- Public administration
- Professional, scientific, and management and administrative, and waste management services
- Educational services, health care, and social assistance
- Arts, entertainment, recreation and accommodation and food services
- Other services, except public administration
- Management, business, science, and arts occupations
- Service occupations
- Sales and office occupations
- Natural resources, construction, and maintenance occupations
- Production, transportation, and material moving occupations
- Median Income in the Past 12 Months (in 2023 Inflation-Adjusted Dollars) by Veteran Status by Sex for the Civilian Population 18 Years and Over with Income
- Median Age by Sex (Hispanic or Latino)
- Political parties (republican or democrat) of the elected representatives in the U.S. Congress by Congressional District were obtained from public sources.
- The IP address (latitude and longitude) of each survey respondent was automatically delivered with the survey data—a standard process for all online surveys.
- Geographic shapefiles that define block group and congressional district geographical borders were downloaded from the U.S. Census Bureau API.
- The shapefiles and IP addresses were used to merge the block group, census tract, and congressional district data with the respondent data.
- Machine learning was used to build a set of models to predict the probability of segment membership.
- Accuracy of predictive models was evaluated using machine learning techniques.
- Geographic maps were produced, depicting the predicted incidence of each segment at the block group level.
- Conclusions were drawn based on the analysis and mapping.
Additional Analytic Detail
The modeling data was randomly split into training (n = 1218) and test data (n = 519). The training data was balanced using SMOTE (Synthetic Minority Oversampling Technique). In this case, resampling was done for both members and non-members of segments.
Seven binary classification models were trained using 10-fold cross-validation resampling. Initially, 16 different kinds of models were trained. Model performance was evaluated using the metrics: accuracy (% correctly assigned to the segment), AUC (area under the receiver-operator curve), recall (% of actual segment members correctly predicted), precision (% of predicted segment members correctly predicted), and F1 (a combined metric based on both precision and recall).
After evaluating the performance of each type of model, the extreme gradient boosting (xgboost) model was selected for each segment. Final segment models were tuned using all the SMOTE training data (1218 unique data points) to produce the final set of seven segment predictive models.
Test data (untouched until the final step) was used to produce lift curves for each segment using the final predictive models. The lift curves provided an objective assessment of how much better vs. chance each model performs in identifying true segment membership.
Modeled incidence of segment membership was mapped at the block group level for all block groups. The model’s predicted probability was used as the incidence of each block group.
Results
The xgboost model performance metrics were quite high, suggesting the models’ ability to accurately predict segment membership.
Table Two: Model Training Performance Metrics—Averaged Across Ten Training Samples

*Accuracy is percent of observations correctly predicted. AUC is the area under the Receiver Operator Curve—an alternative measure of accuracy that does not depend on a threshold value to convert a probability into a binary (segment member vs. non-member). Recall is the percentage of actual segment members who were correctly predicted. Precision is the percentage of predicted-to-be-segment-members who were correctly predicted. F1 is the harmonic mean of precision and recall.
The capability to determine which segment an individual is a member of, given the individual’s IP address, was reasonably good based on the lift curves produced with test data. Since the test data was not used in model training, the lift curves suggest how well marketing programs can target individuals in a particular segment.
The lift for the top 10% of the test respondents most likely to be in the segment ranges from 4.0 for segment 5 to 1.6 for segment 7, a median lift of 2.1. A lift of 2.1 is acceptable given the sample size of the training data (n = 1218).

“Lift” is the improvement achieved (vs. chance) when using the model to reach segment members. For example, if one were to use the segment 5 model to pick out 10% of a list; then, this 10% would reach 4 times more segment 5 individuals than if one were to randomly select 10% of the same list.
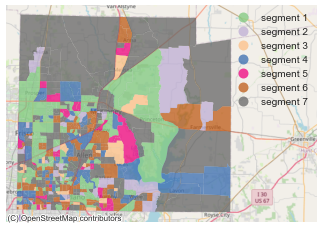
Since the predictor data used to model segment membership was based on geography, the model can be used to predict both the incidence of segments and the dominant segment for almost any geographic area. For example, figure one below shows the dominant segment for each of the 18,638 block groups in Texas.
Figure One: Dominant Segment for Census Block Groups in Texas

Figure 2 depicts the same information for 2 counties in Texas, Dallas County and Collin County.
Collin County
Dallas County
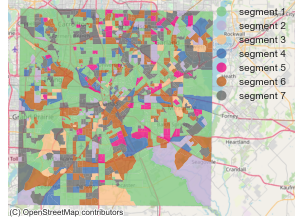
Dallas County (population of 2.6 million) includes many areas of segment 1 (younger and lower income individuals) compared to Collin County (population of 1.2 million).
Focusing on the population centers in Collin County (smaller surface area block groups), it’s evident that a higher percentage of block groups are dominated by segments 4, 5, and 6, whose members have higher incomes. More rural areas (larger surface area block groups further from the city centers) are dominated by segment 7 (grey areas), which is the lowest income segment.
Overall, the segment models reveal all segments within each county, living near one another. which suggests that a mixture of opinions exist in small geographic areas in these two Texas counties. Clearly the segment models suggest that targeting by geographic block group shows some promise as a basis for targeting these segments with content and messaging themes related to concerns about the economy.
Conclusions
The overall conclusion from this research is that segments based on survey open-ended textual responses can be successfully targeted using online IP addresses and publicly available data.
One would assume and hypothesize that the addition of even more detailed individual data available from CRMs, transactional and credit-bureau databases, and online journey records would improve the segment targeting models, over and above what was found in this research-which used only publicly available data at the Census block-group level. However, this hypothesis must be tested with additional research.
Since Large Language Models (LLMs) produced the variables (embeddings) which, in turn, produced the clusters or segments of individuals, and AI summarized the beliefs, values, and opinions present within the clusters, much of the credit (for ability to target) should be given to LLMs and AI. That the cluster members are targetable and findable suggests that textual data can provide a valuable additional data source for direct marketing campaigns to target specific segments.
Author

John Colias, Ph.D.
Senior VP Research & Development
As a leader with both university teaching and business consulting experience, John focuses on predictive modeling, prescriptive analytics, and artificial intelligence. As Senior Vice President, Research & Development, at Decision Analyst, John combines academic and business interests to help analytics professionals by offering cutting-edge analytic solutions tempered by business realism. He holds a doctorate in economics from The University of Texas at Austin, with specializations in econometrics and mathematical modeling methods.
Copyright © 2025 by Decision Analyst, Inc.
This posting may not be copied, published, or used in any way without written permission of Decision Analyst.