
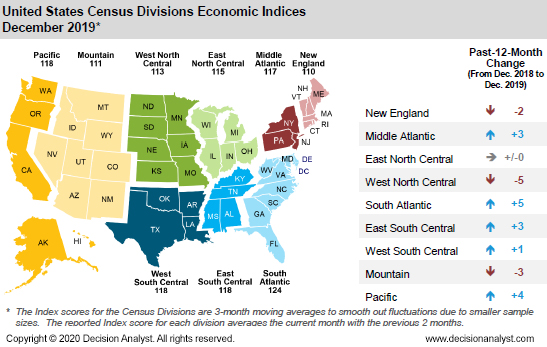
Decision Analyst’s Economic Index U.S. Census Divisions December 2019
Several of the U.S. Census Divisions saw declines in the past 12 months. The West North Central Census Division declined by 5 points, while the Mountain Census Division declined by 3 points. The South Atlantic Census Division increased by 5 points and the Pacific Census Division increased by 4 points. The following charts are 3-month moving averages, so the numbers are lower than the overall Economic Index (that is, the time periods covered are slightly different). This aberration will correct itself over time.
United States Economic Index
The Decision Analyst U.S. Economic Index stood at 117 in December 2019, an increase of 4 points over the same month one year ago. Over the past 12 months, the Economic Index has remained essentially flat. This suggests that the U.S. economy will continue to grow at a slow pace in the coming months (i.e., at less than a 2% annual rate). The Economic Index tends to lead overall U.S. economic activity by 6 to 12 months. Below is the past-20-year history of the U.S. Economic Index.
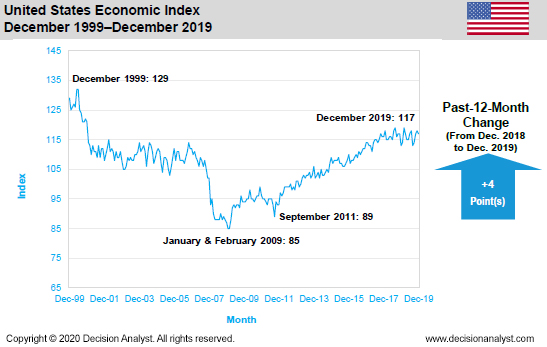
“A quick look at the Economic Index graph above reveals that the Index has been essentially flat for the past 2 years,” said Jerry W. Thomas, President/CEO of Decision Analyst. “U.S. consumers are doing their part to keep the economy strong—they have continued to spend money. The government has massively stimulated the economy through low interest rates and deficit spending, an effort that cannot be long sustained. U.S. corporations, however, are the laggards. They have not done their part. It was hoped that the corporate tax cuts at the beginning of 2018 would lead to a rising tide of business investment. Instead, major corporations have used most of the tax cuts to buy back their stocks, a counterproductive waste of money and a short-term “artificial” stimulus to stock markets. Trade disputes and tariffs are having a negative effect on the U.S. economy as well, as are labor shortages in some industries. Manufacturing is in a prolonged slowdown, and the service side of the economy is also trending downward. Slowing economic growth in Europe and China poses added risks for the U.S. economy,” said Thomas.
Index History
The division-by-division results are presented in the graphs below. Remember, the Census Division graphs portray 3-month moving averages.
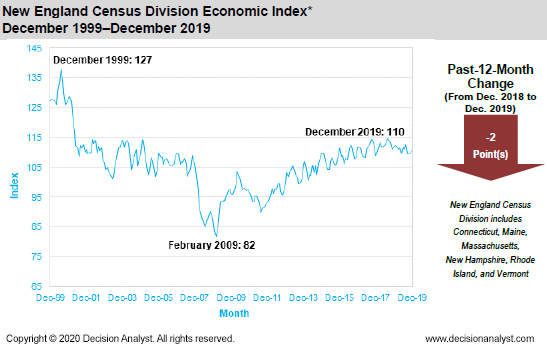
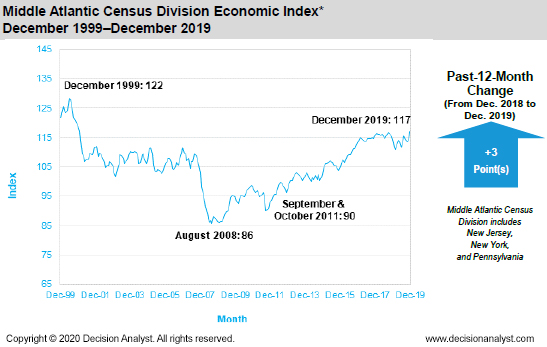
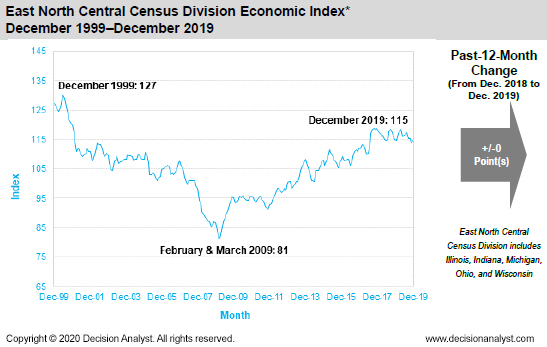
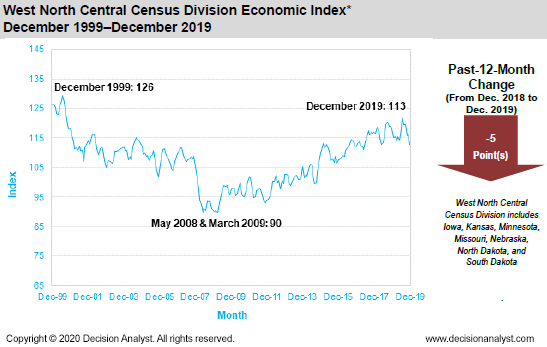
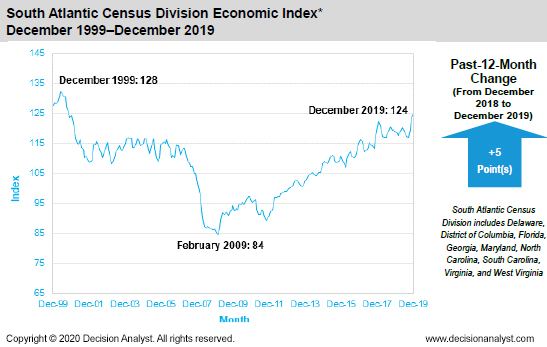
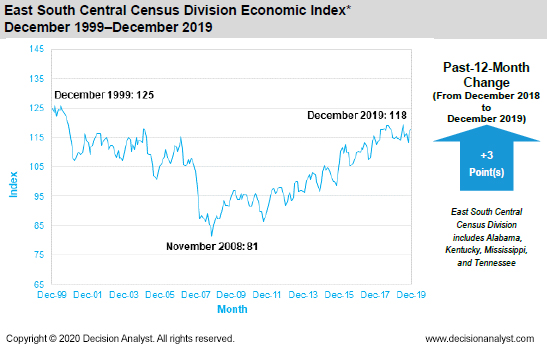
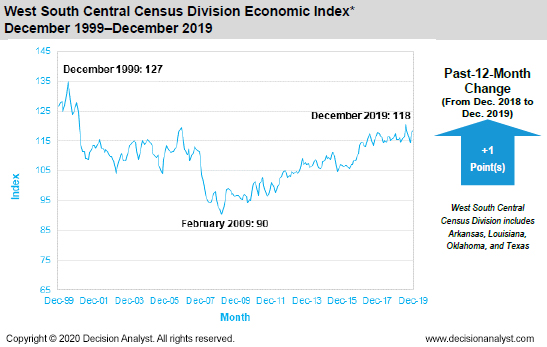
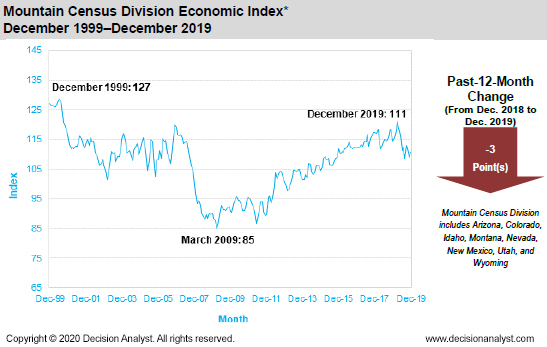
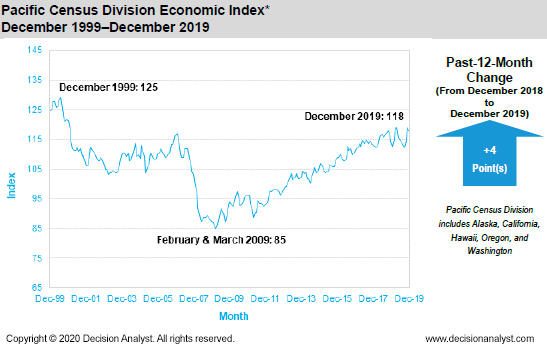
*Census Division Three-Month Moving Average
The Index numbers for the census divisions are three-month moving averages to smooth out fluctuations due to smaller sample sizes. The reported Index number averages the current month with the two previous months.
Methodology
The Decision Analyst Economic Index is based on a monthly online survey of several thousand households balanced by gender, age, and geography. The scientific survey is conducted in the last 10 days of each month. The Economic Index is calculated from 9 different economic measurements using a sophisticated econometric model. The result is a snapshot of coming economic activity in each country surveyed, as seen through the eyes of representative consumers living in the respective countries.
Decision Analyst conducts its concurrent economic surveys each month in Argentina, Brazil, Canada, Chile, Colombia, France, Germany, India, Italy, Mexico, Peru, the Russian Federation, Spain, and the United States. Whenever the Decision Analyst Economic Index is greater than 110, it tends to signal an expanding economy. An Index value of 90 to 110 suggests a no-growth or slow-growth economy, and near or below 90 generally indicates economic contraction. These guidelines vary by country, however.
About Decision Analyst
Decision Analyst (www.decisionanalyst.com) is a global marketing research and analytical consulting firm specializing in strategy research, new product development, advertising testing, and advanced modeling for marketing decision optimization. For over 40 years, the firm has delivered competitive advantage to clients throughout the world in consumer packaged goods, telecommunications, retail, technology, medical, and automotive industries.
Media Contact
Cristi Allen
Publicity
Email: callen@decisionanalyst.com
Phone: 1-800-ANALYSIS (262-5974) or 1-817-640-6166
Address: 604 Avenue H East
Arlington, TX 76011
Download the PDF File
Library
Interactive Economic Index
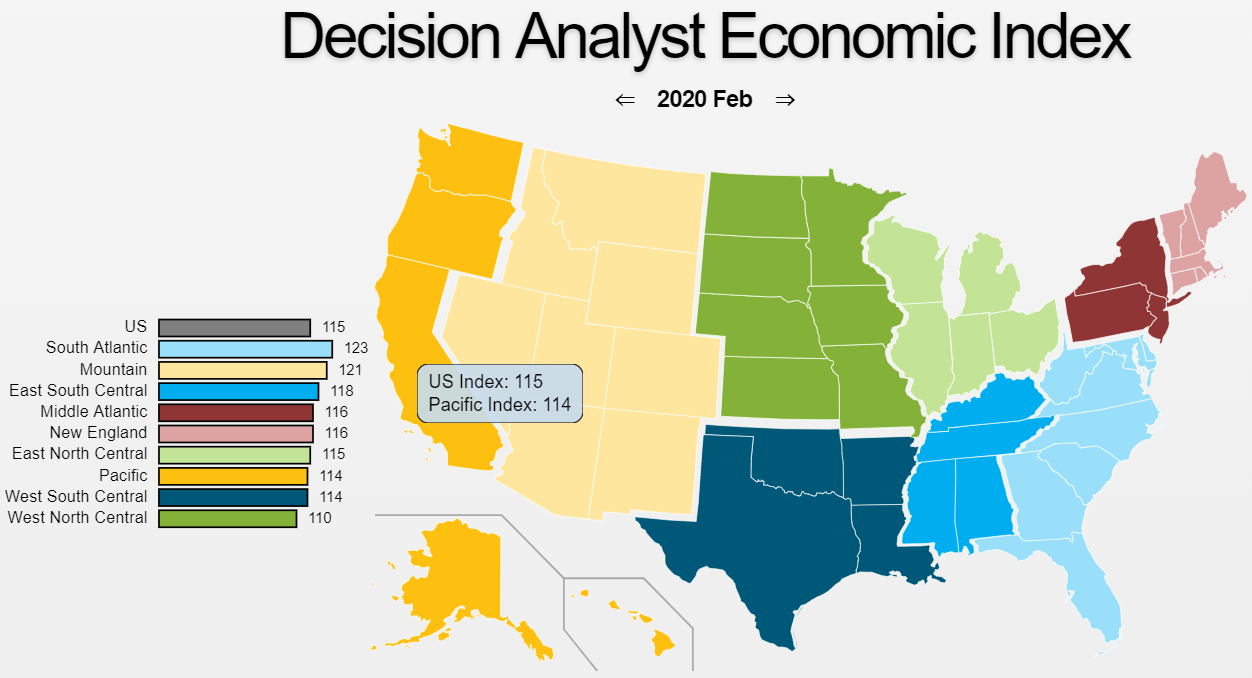
Click on the map above to open Decision Analyst's Interactive Map for the United States and its nine census divisions.
Logos & Images
If you are doing a story on Decision Analyst or using any of our published data, news releases or articles, you must cite "Decision Analyst" as the source of the information.
If you use any of the charts or tables from the press releases or other published materials, please email Cristi Allen at callen@decisionanalyst.com to let us know which graphics you took and for what newspaper, magazine, or website it was used.