
Decision Analyst’s Economic Index U.S. Census Divisions May 2019
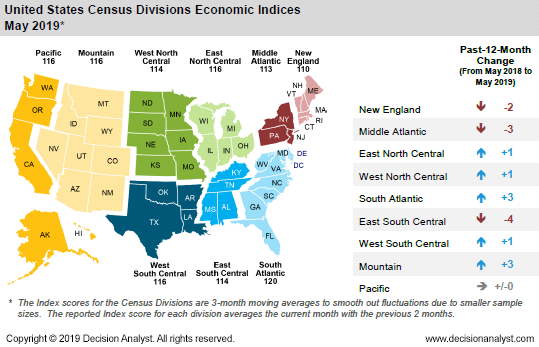
Arlington, Texas—The Mountain and the South Atlantic Census Divisions each increased 3 points in the past 12 months. Meanwhile, the East South Central Census Division declined 4 points in the past 12 months and the Middle Atlantic Census Division declined 3 points. The Pacific Census Division remains unchanged over the past 12 months.
United States Economic Index
The Decision Analyst U.S. Economic Index stands at 115 for May 2019, the same score as the previous month. Over the past 12 months, the U.S. Economic Index is basically flat (a 1-point decline from May 2018). The overall long-term trend of the Economic Index over the past 2 years is relatively flat, an indication of slowing economic growth as 2019 unfolds. The Economic Index tends to lead overall U.S. economic activity by 6 to 12 months. Below is the past-10-year history of the U.S. Economic Index.
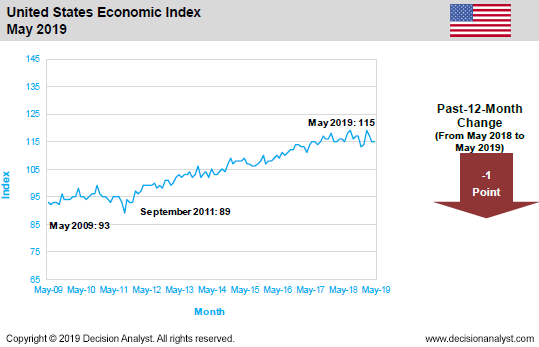
“The overall pattern of the U.S. Economic Index over the past 24 months is suggesting slowing economic growth in the U.S. during the second half of the year. While U.S. GDP growth in 2018 will come in close to 3%, GDP growth in 2019 is likely to be closer to 2%. Decisions coming out of Washington, D.C., are disrupting and dampening U.S. economic activity. Tariffs, trade disputes, immigration crackdowns, hostility toward other countries, and governmental chaos tend to increase uncertainty for consumers and businesses, encouraging both groups to go slowly and avoid major financial commitments. Major corporations are failing to invest in new products, research and development, or new plant and equipment--as they squander the tax cut by buying back their own stocks,” said Jerry W. Thomas, CEO/President of Decision Analyst. “Economic weakness in Europe and China are also worrying.”
Index History
The division-by-division results are presented in the graphs below. Remember, the Census Division graphs portray 3-month moving averages.
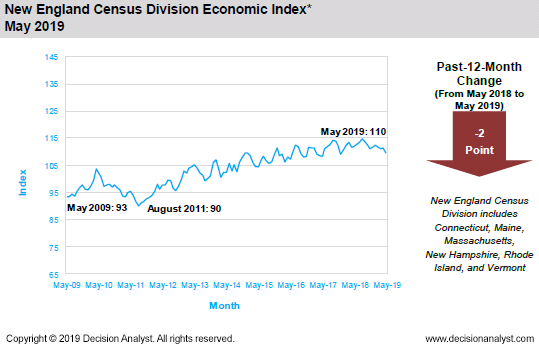
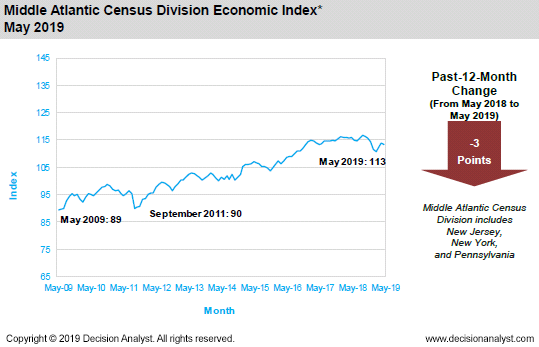
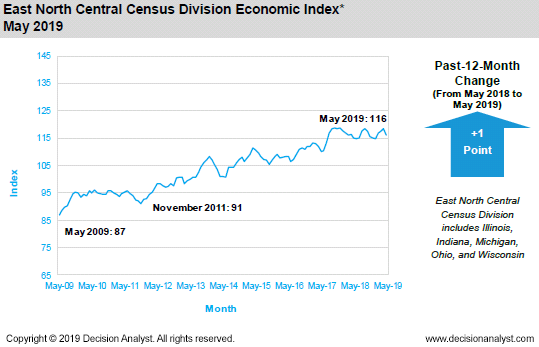
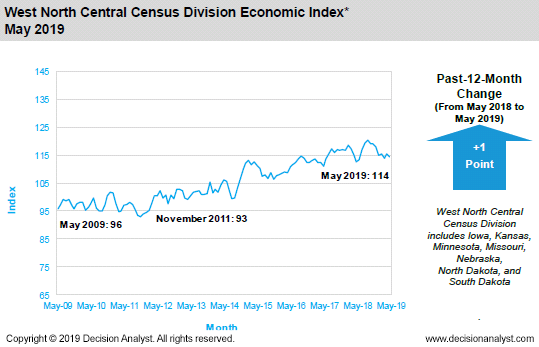
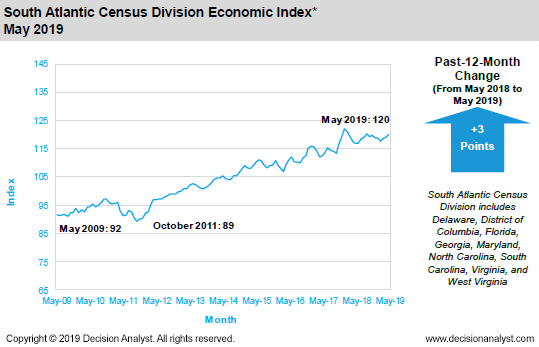
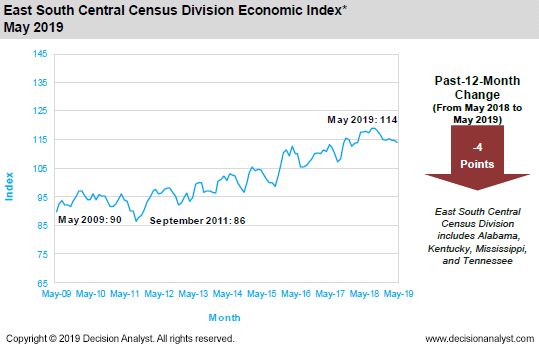
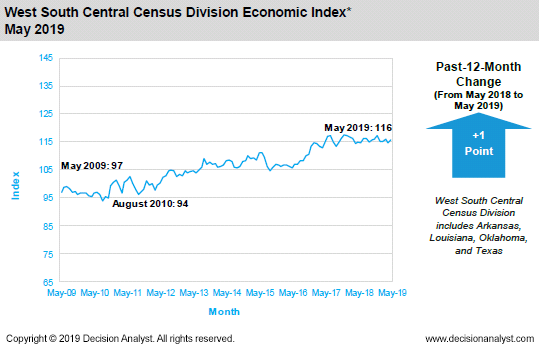
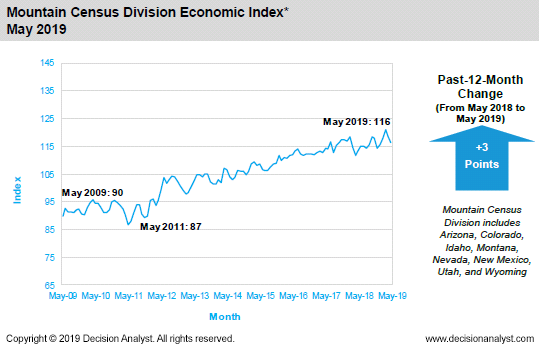
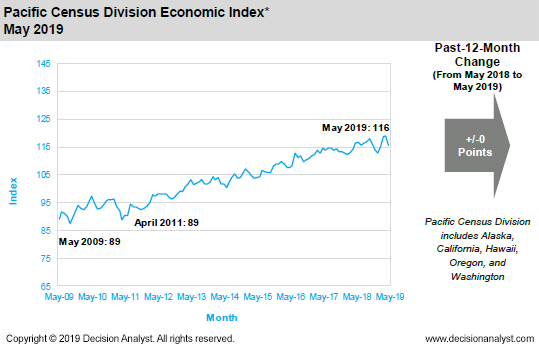
*Census Division Three-Month Moving Average
The Index numbers for the census divisions are three-month moving averages to smooth out fluctuations due to smaller sample sizes. The reported Index number averages the current month with the two previous months.
Methodology
The Decision Analyst Economic Index is based on a monthly online survey of several thousand households balanced by gender, age, and geography. The scientific survey is conducted in the last 10 days of each month. The Economic Index is calculated from 9 different economic measurements using a sophisticated econometric model. The result is a snapshot of coming economic activity in each country surveyed, as seen through the eyes of representative consumers living in the respective countries.
Decision Analyst conducts its concurrent economic surveys each month in Argentina, Brazil, Canada, Chile, Colombia, France, Germany, India, Italy, Mexico, Peru, the Russian Federation, Spain, and the United States. Whenever the Decision Analyst Economic Index is greater than 110, it tends to signal an expanding economy. An Index value of 90 to 110 suggests a no-growth or slow-growth economy, and near or below 90 generally indicates economic contraction. These guidelines vary by country, however.
About Decision Analyst
Decision Analyst (www.decisionanalyst.com) is a global marketing research and analytical consulting firm specializing in strategy research, new product development, advertising testing, and advanced modeling for marketing decision optimization. For over 40 years, the firm has delivered competitive advantage to clients throughout the world in consumer packaged goods, telecommunications, retail, technology, medical, and automotive industries.
Media Contact
Cristi Allen
Publicity
Email: callen@decisionanalyst.com
Phone: 1-800-ANALYSIS (262-5974) or 1-817-640-6166
Address: 604 Avenue H East
Arlington, TX 76011
Download the PDF File
Library
Interactive Economic Index
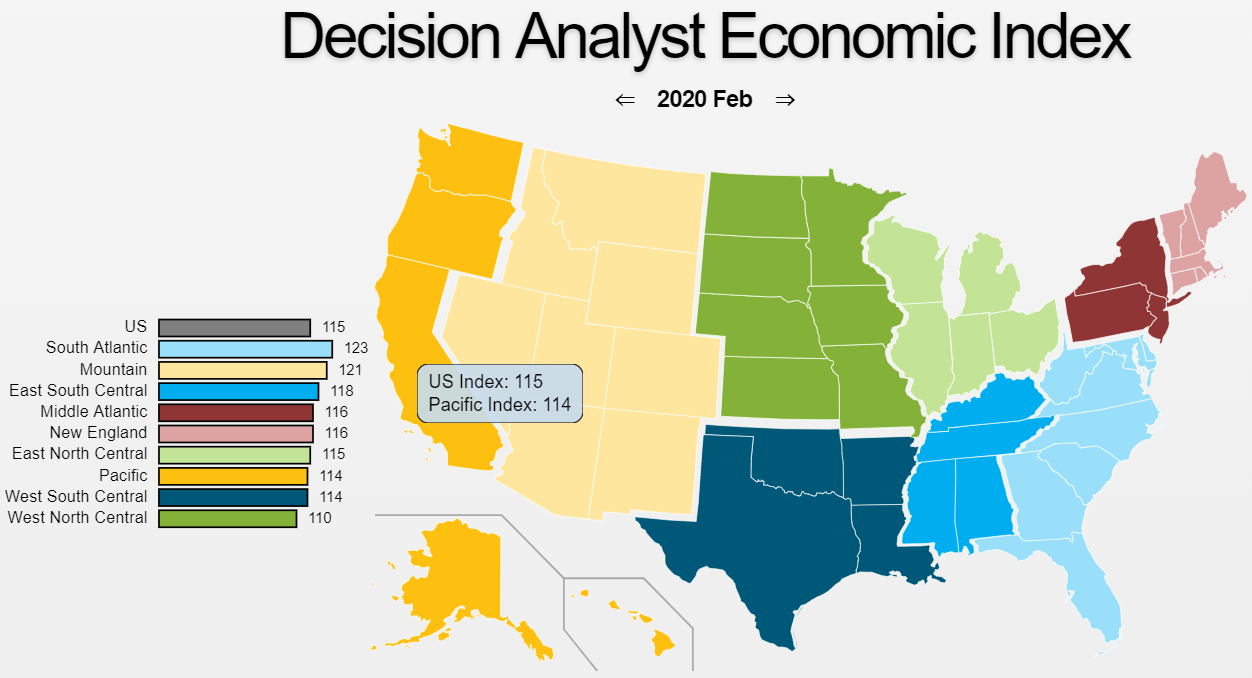
Click on the map above to open Decision Analyst's Interactive Map for the United States and its nine census divisions.
Logos & Images
If you are doing a story on Decision Analyst or using any of our published data, news releases or articles, you must cite "Decision Analyst" as the source of the information.
If you use any of the charts or tables from the press releases or other published materials, please email Cristi Allen at callen@decisionanalyst.com to let us know which graphics you took and for what newspaper, magazine, or website it was used.