
Decision Analyst’s Economic Index U.S. Census Divisions August 2018
The East South Central, the South Atlantic, and the West North Central Census divisions tied for the highest Index score for August (119). The East South Central Census Division increased the most, gaining 12 points in the past 12 months, while the South Atlantic Division gained 5 points. The Mountain region had the lowest Index score, 114 for August 2018, a 1-point increase from August 2017.
United States Economic Index
The Decision Analyst U.S. Economic Index stands at 119 for August 2018, a 5-point increase from the same time period a year ago. The overall trend of the Economic Index indicates that U.S. economic growth is continuing and that the last quarter of 2018 and the first quarter of 2019 will also show economic improvement. The Economic Index tends to lead overall U.S. economic activity by 6 to 12 months. Below is the past-10-year history of the U.S. Economic Index.
“The U.S. Economic Index continues to signal future growth, but barriers and risks remain. The newly imposed tariffs and the threats of additional tariffs pose the greatest risks to future U.S. economic growth. Trading agreements are massive documents setting forth the ground rules for mutual trade. Any disruption of these agreements could quickly lead to reduced trade and reduced economic activity. Rising interest rates and the growing mountain of corporate and governmental debt are also inhibitions to higher rates of economic growth,” said Jerry W. Thomas, President/CEO of Decision Analyst. “Looking forward, the macroeconomic picture is troubled. The dangers of recession or marginal growth lurk just over the horizon.”
Index History
The division-by-division results are presented in the graphs below. Remember, the Census Division graphs portray 3-month moving averages.
*Census Division Three-Month Moving Average
The Index numbers for the census divisions are three-month moving averages to smooth out fluctuations due to smaller sample sizes. The reported Index number averages the current month with the two previous months.
Methodology
The Decision Analyst Economic Index is based on a monthly online survey of several thousand households balanced by gender, age, and geography. The scientific survey is conducted in the last 10 days of each month. The Economic Index is calculated from 9 different economic measurements using a sophisticated econometric model. The result is a snapshot of coming economic activity in each country surveyed, as seen through the eyes of representative consumers living in the respective countries.
Decision Analyst conducts its concurrent economic surveys each month in Argentina, Australia, Brazil, Canada, Chile, Colombia, France, Germany, India, Italy, Mexico, Peru, the Russian Federation, Spain, United Kingdom, and the United States. Whenever the Decision Analyst Economic Index is greater than 110, it tends to signal an expanding economy. An Index value of 90 to 110 suggests a no-growth or slow-growth economy, and near or below 90 generally indicates economic contraction. These guidelines vary by country, however.
About Decision Analyst
Decision Analyst (www.decisionanalyst.com) is a global marketing research and analytical consulting firm specializing in strategy research, new product development, advertising testing, and advanced modeling for marketing decision optimization. For over 40 years, the firm has delivered competitive advantage to clients throughout the world in consumer packaged goods, telecommunications, retail, technology, medical, and automotive industries.
Media Contact
Cristi Allen
Publicity
Email: callen@decisionanalyst.com
Phone: 1-800-ANALYSIS (262-5974) or 1-817-640-6166
Address: 604 Avenue H East
Arlington, TX 76011
Download the PDF File
Library
Interactive Economic Index
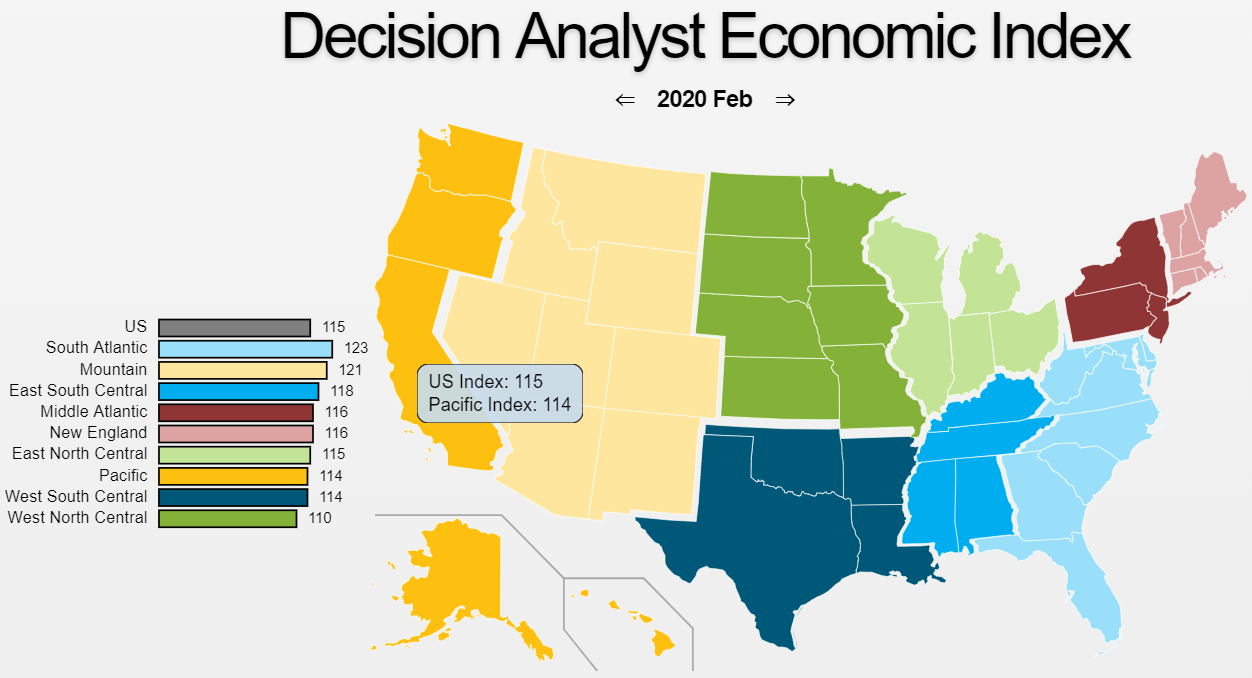
Click on the map above to open Decision Analyst's Interactive Map for the United States and its nine census divisions.
Logos & Images
If you are doing a story on Decision Analyst or using any of our published data, news releases or articles, you must cite "Decision Analyst" as the source of the information.
If you use any of the charts or tables from the press releases or other published materials, please email Cristi Allen at callen@decisionanalyst.com to let us know which graphics you took and for what newspaper, magazine, or website it was used.