
Multidimensional Market Segmentation
by Felicia Rogers, Diane Brewton, and Elizabeth Horn, Ph.D.
-
Market segmentation is widely accepted as the foundation for the development of marketing strategy.
Segmentation analyses can help identify optimal target markets and can help guide the development of product, positioning, and messaging strategies to reach the target segments.
Markets can be segmented in many different ways, using many different methods and tools. For most survey-based datasets, all of the relevant variables are thrown into a multivariate bucket and, magically, are transformed into market segments. Some judgment is involved in this process, so it’s not statistically immaculate. One possible downside of this approach is that too many apples, oranges, and bananas are mixed together in each segment—so the results are somewhat confusing.

Multidimensional segmentation represents the other extreme. Rather than throwing all of the variables into one bucket, the variables are grouped into several buckets. For example, you might put all of the pricing data together and segment the whole dataset along this dimension. Then you might group together the data related to retail shopping behavior and segment along a retail shopping spectrum. You could also divide up the dataset by media consumption patterns, lifestyle and attitudes, brand perceptions, and so forth. As these different groups of variables are segmented, parallel and independent segmentations are created. Each respondent then falls into multiple segments (i.e., a pricing segment, a retail shopping segment, a lifestyle segment, a media segment). Each respondent’s various segment memberships are recorded in the dataset.
This paper presents a case study to demonstrate how multidimensional segmentation (the intersection of multiple segmentation solutions driven by different groups of consumer attitudes, perceptions, and behaviors) can be applied to a massive database of survey-based variables and data. To illustrate, let’s suppose that our assignment was to identify the most profitable consumer market for an imaginary product called “Power Sprinkles” and to formulate the outlines of a go-to-market strategy.
“Power Sprinkles” are envisioned as small granules that can be eaten alone as a snack or can be added to other foods as a topping or ingredient. They are organic and rich in antioxidants. They are designed to provide the consumer with an effective energy boost for several hours.
The Landscape
The starting point was a massive database of consumer health-and-wellness attitudes and behaviors. This database is populated by ongoing survey research. Health and Nutrition Strategist™ (or HANS™) is the name of this syndicated dataset. It covers the following major topic areas:
- Grocery shopping behavior
- Food and beverage consumption
- Restaurant usage and attitudes
- Lifestyle attitudes
- Ingredient seeking and avoidance
- Belief in “magic foods”
- Nutritional knowledge and attitudes
The database contains tens of thousands of data points, based on thousands of surveys. When we set out to identify the optimal market for “Power Sprinkles,” there were many options to consider. Should we look for people who believe strongly in “super foods”? Should we start with folks who seem to be couch potatoes? What about health nuts—maybe they would be a good starting point. Wait, perhaps certain attitudes about nutrition would lead us down the best path. Or would health conditions, such as diabetes or obesity, be an indicator of interest? It’s easy to get confused and easy to get lost in such a massive dataset.
Simplicity Is a Beautiful Thing
The first step toward transforming this mountain of data into actionable information was to simplify. Our objective was to create a more manageable way to look at consumers as a way to understand and classify them. As marketers, we call this segmentation. This term is commonly used to describe the process of dividing customers into groups that, within, are similar in one or more ways. Segmentation can be done through simple means, or it can be carried out using sophisticated analytical techniques. Either way, it provides the marketer with a series of lenses through which to examine and understand the customer base. You could think of these lenses as portholes that allow you to peer into a section of your sea of customers and potential customers.
Many companies find the traditional type of segmentation useful (i.e., putting all the variables into one bucket). It can be an effective way to divide up a market, such as users of ketchup, into more uniform groups based on demographics, behaviors, attitudes, or other characteristics. Looking at customer groups in this way can help guide new product development, help design effective messaging and positioning, and help target the advertising. However, traditional segmentation is often confusing because too many variables are crammed into the same bucket.
Visualize the scene if you could step back from that series of portholes into a big-picture view of the entire ocean. Go ahead—do it. Take a good look at all of the fish and see how they interact. They travel in schools, but they cross paths. They swim in and out, back and forth, almost like a complex and very beautiful piece of music.
Imagine applying this to your business. The “fish” are customers, as defined by demographics, behaviors, and attitudes. They are not segregated into their own “schools.” Their attitudes and behaviors don’t appear to be coordinated or harmonized in any way. This is where segmentation comes in, to help us see the harmonies via sophisticated statistical inferences. Let’s touch on the segmentation methods used in this example, before completing the “Power Sprinkles” marketing outline.
Segmentation Tools
A number of tools exist for segmenting customers that constitute markets. Segmentation is both a science and an art. There are no perfect or “correct” solutions.
At the most basic level, consumers can be grouped based on the analyst’s intuition or based on hard facts. For example, separating males and females for comparison purposes is one form of segmentation. To this end, cross-tabulated data provide a very effective first-stage look at customer groups and often serve as a first step in segmentation analysis. A couple of other techniques include Factor Segmentation™ and latent class cluster analysis.
Factor Segmentation™
Factor Segmentation™ is a technique that begins by using factor analysis to classify a large number of attitudes or image attributes into groups, reducing the list down to a smaller, more manageable set of key themes. Through a combination of statistics and product category knowledge (science and art), an optimal number of factors are identified. Once factors have been developed, respondents are individually scored across the factors based on their responses to the attributes within each factor. Respondents are assigned to the factor where they score the highest—each factor represents a market segment. This segmentation technique is highly reliable. Factor structures and resulting segment structures are stable and consistent over time—across multiple waves of data collection.
Latent Class Cluster Analysis
In contrast to the step-wise approach of Factor Segmentation™, latent class cluster analysis uses a probability model to find the cluster solution that best fits the data. The model is able to predict patterns in the data based on several variables (such as attitudes and needs). It determines the relationships between dependent variables and an independent variable such as buying behavior. For each survey respondent, latent class cluster analysis delivers the probability of belonging to each cluster (or market segment). Respondents are assigned to the cluster to which they have the highest probability of belonging. Similar to Factor Segmentation™, latent class cluster analysis produces stable segments across multiple data sets.
Putting the Tools to Work
As mentioned earlier, there were many analytical paths we could have taken (active people, couch potatoes, diabetics, etc.). We investigated many potential markets and determined that frequent organics consumers were a very promising target market. So the multidimensional segmentation analysis was focused on the organics consumers.
In this case study a variety of segmentation techniques were used, and the resulting segments and consumer groupings were layered to create multiple dimensions on which to analyze the organics consumer base. More than 16,000 HANS™ respondents were segmented in the following five areas:
- Lifestyle
- Shopper behavior
- Grocery retailer usage
- Nutritional claims
- Media usage
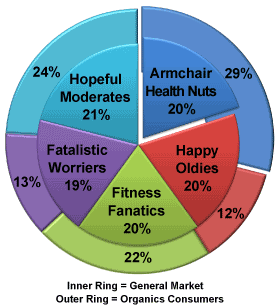
We identified five lifestyle segments, each about equal in size as shown in the Lifestyle Segments chart below. For the sake of space, we will not profile each segment in this paper. We will focus on the segment(s) most relevant for our “Power Sprinkles” case (based on its high index in the organics consumer target audience): Armchair Health Nuts (29% of the base organics consumer target versus 20% of the general population). These consumers tend to seek vitamins; eat lots of fruits and vegetables; be interested in organics; choose healthful, high-quality proteins; select foods that reduce heart disease; and believe that moderation is key to good health. However, they do not exercise much and are not very active overall. Generally, they have not achieved the best physical health, but they aspire to do so.
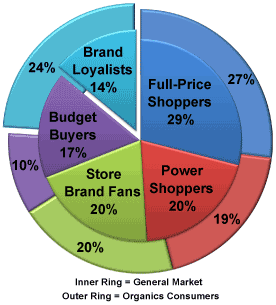
Next we looked at shopping behavior and identified five segments on this basis as shown in the Shopper Behavior Segments chart below.
Though Brand Loyalists are the smallest segment of the general population (14%), they are significantly more valuable within the “Power Sprinkles” organic target market (24%). In contrast to other shopper groups, these shoppers tend to embrace brand names of all types and are willing to pay more for nationally advertised brands. They enjoy grocery shopping, browsing the aisles, and discovering new items. Their peers tend to see them as trusted advisors with respect to new food products. These shoppers also feel strongly about the good selection of natural and organic products found in their preferred supermarkets.
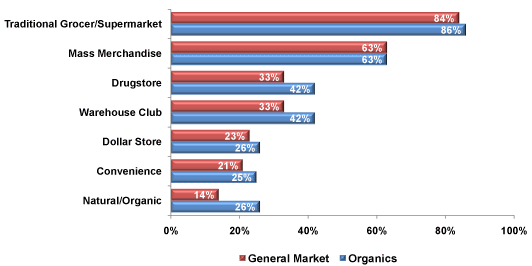
Next, grocery retailer usage was identified and segmented differently, as shown in the Retailer Segments chart below. Rather than developing mutually exclusive groups or segments based on retail shopping behavior, consumers fell into multiple retailing segments (that’s reasonable because we all shop at different stores at different times). The “Power Sprinkles” organics target customer is much more likely than average to shop in natural/organic supermarkets (26%, compared to 14% of the general population) and somewhat more likely than average to favor warehouse club stores (42% versus 33%, respectively).
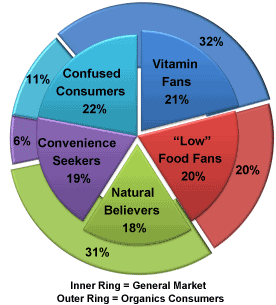
In regard to nutritional claims, five population segments emerged, as shown in the Nutritional Claims Segments chart on this page. Here is where the definition of the “Power Sprinkles” target market begins to crystallize. There is overlap and correlation across nutritional claims segments and lifestyle segments.
Vitamin Fans and Natural Believers are most relevant for “Power Sprinkles” (32% and 31% of the organics target market, respectively, compared to 21% and 18% in the general population), mirroring some of the same attitudes we saw in their lifestyle descriptors. As the name implies, Vitamin Fans choose foods containing or fortified with vitamins, and they actively avoid allergens. They tend to be healthy and do most of the meal preparation in their homes. Many Natural Believers say they always choose foods with organic or natural ingredients. They tend to believe home-prepared foods are the healthiest. They also tend to be very healthy and exude confidence in their healthy food choices.
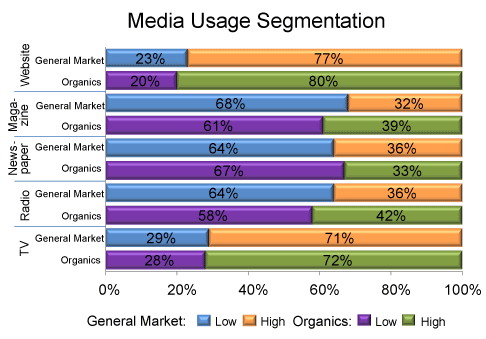
Finally, the media segments are defined by light and heavy usage of key forms of media. There is a tremendous amount of strength, as expected, with television as well as the Internet, as shown in the Media Usage Segmentation chart below. (Keep in mind that this research was conducted online using a panel of Internet users, so website usage is likely overreported in the general population.) As we look at the organic target population, we see that high radio listenership and magazine readership are stronger than among the general population (42% versus 36%, and 39% versus 32%, respectively). The behaviors and attitudes we segmented provide a solid platform for further analysis. In the following section, we’ll discuss the process we went through to identify a very well-defined target market for “Power Sprinkles.”
Applying the Knowledge
Once we segmented the respondent base on these various dimensions, we began looking for intersections—groups of characteristics that would lead us down the yellow brick road to the land of Oz.
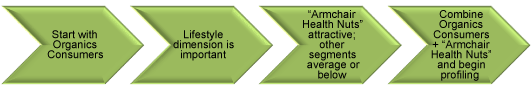
This process did lead us to a unique group of consumers who appear highly likely to purchase and consume our “Power Sprinkles.” We have already made references to the organics target market in the previous sections. Here is how we went about the task of finalizing that target. In searching for the ideal target, the path looked something like this:
- We had settled on Organics Consumers after a thorough investigation of high-level consumer groups. This was the initial springboard.
- Because lifestyle appeal can be critical for a product like this, we looked next to the lifestyle segments.
- Armchair Health Nuts were significantly overrepresented among Organics Consumers.
- Other segments were about average or dramatically below average.
- So we combined the organics base with the Armchair Health Nuts as the foundational target audience for further investigation and definition.
To complete the puzzle, we profiled Organics Consumers who are Armchair Health Nuts as shown in the table below.
By profiling consumers on multiple dimensions, we were able to paint a clear picture of the consumers who are most likely to embrace “Power Sprinkles.” These consumers are not currently fulfilled in terms of their health goals, but they aspire to do much better. They are on a quest for natural and organic products, along with antioxidants to help them in this pursuit. In addition, they like new products. They enjoy the discovery and tend to be early adopters—perfect for a unique, new product like this one.
With effective branding, we could build a loyal audience, as this target is very brand conscious and brand loyal. We know we can reach them in natural/organic grocery channels, as well as in club stores. And we can attract attention through health-related websites, as well as educational, cooking, and women’s television programming.
Final Thoughts
Multidimensional segmentation is a powerful conceptual model for the analysis of large and complex datasets. By subdividing the dataset into closely related topic areas (buckets), and then segmenting on the variables within each bucket, multiple and independent segmentations of the whole dataset are possible. Because each segmentation is independent, each segmentation solution can be cross-tabbed by any of the other segmentation solutions. This approach greatly simplifies the analysis of segmentation possibilities, and it very often leads to innovative marketing solutions.
About the Authors
Felicia Rogers (frogers@decisionanalyst.com) is an Executive Vice President and Elizabeth Horn, Ph.D., (ehorn@decisionanalyst.com) is Vice President of Advanced Analytics at Decision Analyst. The authors may be reached by phone at 1-800-262-5974 or 1-817-640-6166.
Copyright © 2016 by Decision Analyst, Inc.
This article may not be copied, published, or used in any way without written permission of Decision Analyst.